Kirschvink (1992) highlighted three implications of his theory which "might
lend themselves to geological tests". First, "glacial units
should be more or less synchronous Harland, 1964)". Second, "strata
from widely separate areas which preserve a record of these [rapid] climatic
fluctuations [between 'ice house' and 'greenhouse' states]
might bear an overall similarity in lithologic character, which would be
a result of the global scale of the climatic fluctuations". Third, "the
presence of floating pack ice should reduce evaporation, act to decouple
oceanic currents from wind patterns and, by inhibiting oceanic to atmospheric
exchange of O
2, would enable the oceanic bottom waters to stagnate and
become anoxic. Over time, ferrous iron generated at the mid-oceanic ridges
or leached from the bottom sediments would build up in solution and, when
circulation became reestablished toward the end of the glacial period,
the iron would oxidize to form a 'last-gasp' blanket of banded
iron formation in upwelling areas." Here is how these tests turned
out.
Test 1: Carbon isotopes
Direct radiometric testing of predicted glacial synchroneity has not proved
possible (
Table 1) because of an apparent dearth of suitable material for
dating (Evans, 2000). Low diversity and turnover rates of microfloral and
protistan remains pose severe limits on biostratigraphic resolution until
after the major Neoproterozoic glacial events (Knoll, 2000). Regardless,
a sea change in favor of synchronous glaciation occurred in the 1990s,
and carbon isotope stratigraphy was principally responsible.
The history of carbon isotopic variation (expressed as δ
13C, the difference
in per mil of
13C/
12C with respect to standard VPDB) in marine carbonates
and covarying organic matter is a robust, but ambiguous, record of biogeochemical
cycling (Summons and Hayes, 1992). Despite the fact that significant spatial
heterogeneity in δ
13C is dynamically maintained within the ocean (Kroopnick,
1985), large secular changes in δ
13C at individual sites are globally correlated
(Veizer et al., 1999; Saltzman et al., 2000), reflecting the residence
time of carbon ~150 times the ocean mixing time (Kump and Arthur, 1999).
The δ
13C of carbonate rocks is relatively immune from large diagenetic
changes because pore fluids are effectively buffered by the large rock
carbon reservoir (Veizer et al., 1999).
The range of secular δ
13C variability of >10‰ in the late Neoproterozoic
(Jacobsen and Kaufman, 1999; Walter et al., 2000) is markedly greater than
for the Phanerozoic (Veizer et al., 1999) or the 1.5 billion years before
the late Neoproterozoic (Brasier and Lindsay, 1998; Kah et al., 2001).
The largest Neoproterozoic δ
13C anomalies consistently bracket LNGD (Fig.
8,9), with enriched values (δ
13Ccarb>5‰) observed prior to glaciation
and depleted values (δ
13Ccarb<0‰) afterwards. A steep decline
in δ
13C values of 10-15‰ precedes any physical evidence of glaciation
or sea-level fall in many areas (Narbonne and Aitken, 1995; Hoffman et
al., 1998b; Brasier and Shields, 2000; McKirdy et al., 2001; Xiao et al.,
2001; Halverson et al., 2002). Cap carbonates are universally depleted,
in some cases approaching mantle values of –6±1‰ (Knoll
and Walter, 1992; Kaufman and Knoll, 1995; Kennedy, 1996; Kaufman et al.,
1997; Hoffman et al., 1998b; Prave, 1999; Brasier and Shields, 2000; Walter
et al., 2000; James et al., 2001). Although interpretations of these remarkable
trans-glacial isotopic shifts differ widely (see below), there is consensus
that they are supra-regional in nature. Even those opposed to the snowball
hypothesis (Kennedy et al., 1998, 2001a,b; Prave, 1999a,b; Condon and Prave,
2000) agree on the synchroneity of glacial events in widely separate areas
(Africa, Australia, Canada, Europe) and base global correlation schemes
upon them.
The conventional explanation for Neoproterozoic carbon isotopic oscillations
and cap carbonates is oceanographic (Knoll et al., 1986; Kaufman et al.,
1991; Derry et al., 1992; Grotzinger and Knoll, 1995; Knoll et al., 1996;
Kaufman et al., 1997; Grotzinger and James, 2000). The idea is roughly
the following. The ocean was physically stratified for long periods pending
glaciation, but switched to a turnover mode during and particularly after
glacial events. In stratified mode, the biological pump (descent of organic
particles from the surface) drove the δ
13C of dissolved inorganic carbon
(DIC) in the surface waters to higher values. Partial remineralization
of the organic "rain" in conjunction with bacterial sulfate
reduction in the water column produced deepwater laden with 13C-depleted
DIC. With prolonged stratification, the contrast in δ
13C values between
the surface and deep water DIC reservoirs (2-3 per mil in the present ocean,
Kroopnick, 1985) increased to >10 per mil, consistent with the pre-glacial
high δ
13C values (Fig. 8). When turnover began, anoxic, alkalinity-laden,
deep water upwelled to the surface, releasing CO
2 and precipitating cap
carbonates with low δ
13C values. Like the snowball hypothesis, the ocean "turnover" model
(Grotzinger and Knoll, 1995; Knoll et al., 1996) seeks to explain many
of the salient observations, but the basic premise is faulty. First, it
is physically difficult if not impossible to shut down the overturning
circulation for periods >1.5 kyrs (Zhang et al., 2001). Second, organic
productivity would crash if the nutrient-rich upwelling flux were removed
(Hotinski et al., 2001). Consequently, stratification would not raise the
δ
13C in surface waters to 5-10‰, as is observed. Third, cap carbonates
formed during post-glacial sea-level rise (see below), when the injection
of glacial meltwater would suppress, not enhance, ocean turnover. Kennedy
(1996) attributes cap carbonates and their low δ
13C values simply to post-glacial
sea-level rise, but his model also depends on an 8-10‰ difference
in δ
13C across the thermocline, compared with ~2.5‰ for Mesozoic-Cenozoic
oceans.
In 1998, we invoked the snowball hypothesis, then in eclipse, as a possible
explanation for the δ
13C profiles (Fig. 8,9) of carbonates bounding glacial
horizons in northern Namibia (
Table 1). Hoffman et al. (1998b) gave three,
mutually compatible explanations for the
12C enrichment observed in cap
carbonates. First, organic productivity on snowball Earth would be greatly
reduced for 106-107 years, which should cause δ
13C values to shift towards
the hydrothermal CO
2 input (–6±1‰ VPDB, Des Marais and
Moore, 1984) at mid-ocean ridges (Kump, 1991). Second, if carbonate sedimentation
rates globally were very high, due to the alkalinity flux from weathering
in the greenhouse transient, the organic fraction of the burial flux would
be negatively effected. Consequently, carbonate would have low δ
13C values
even if organic productivity had fully recovered from the snowball event
(Hoffman and Schrag, 1999). Third, the transfer of atmospheric CO
2 to bicarbonate
(via the weathering cycle) involves an ~8‰ isotopic fractionation
favoring
13C. In transferring >98% of the built-up atmospheric CO
2 to
the ocean and ultimately the sedimentary reservoir, the kinetic isotope
effect (Rayleigh distillation) will drive the atmospheric CO
2 reservoir
to ever lower δ
13C values (Hoffman et al., 1998b). To the degree that atmospheric
CO
2 remains a major source of DIC, this would be reflected by cap-carbonate
δ
13C values that decline with time (Fig. 8). However, the nadir in δ
13C
(Fig. 9) does necessarily correspond to the completion of atmospheric CO
2
drawdown, as Kennedy et al. (2001b) argue, but reflects the net effect
of many factors, including those already mentioned, as well as methane
hydrate destabilization during deglaciation (Kaufman et al., 1997; Kennedy
et al., 2001a; but see Hoffman et al., 2002a) and dolomite-calcite isotopic
equilibrium.
The swing to negative δ
13C values observed beneath the glacial deposits
in many regions (Fig. 8,9) must originate differently (Kennedy et al.,
2001b; Schrag et al., 2002; Halverson et al., 2002) as they are separated
in time from the cap-carbonate anomalies by the glacial periods which were
of long duration (Hoffman et al., 1998a; Sohl et al., 1999). We will discuss
the pre-glacial anomalies, both positive and negative (Fig. 8), and the
larger problem of how snowball events originate, in the penultimate section
of the paper.
Test 2: Cap carbonates
Most LNGD are capped by continuous layers (
Fig. 3-5) of pure dolostone
(and locally limestone), meters to tens of meters thick (Spencer and Spencer,
1972; Williams, 1979; Deynoux, 1980; Fairchild and Hambrey, 1984; Miller,
1985; Preiss, 1987; Aitken, 1991; Fairchild, 1993; Brookfield, 1994; Grotzinger
and Knoll, 1995; Kennedy, 1996; Hoffman et al., 1998a; James et al., 2001;
Corkeron and George; 2001). Their basal contacts are characteristically
abrupt (
Fig. 2c, 2f, 4a and 5a), with little evidence of reworking or significant
hiatus (Norin, 1937; Williams, 1979; Eisbacher, 1981; Deynoux, 1982; Preiss,
1985; Hoffman et al., 1998a; Brasier et al., 2000). Cap dolostones are
transgressive and they typically extend far beyond the confines of their
antecedent glacial deposits, blanketing pre-glacial rocks disconformably
(Wright et al., 1978; Preiss, 1985; Aitken, 1991; Hegenberger, 1993; Hoffmann
and Prave, 1996). They range from thin, allodapic, deepwater deposits (Kennedy,
1996), through agitated shelfal facies (James et al., 2001), near-shore
grainstones and stromatolites (Spencer and Spencer, 1972; Corkeron and
George, 2001), to supratidal tepee beccias (Fig. 5g; Deynoux and Trompette,
1976). "Cap-carbonate sequences" (see below and Fig. 3) share
a distinct set of unusual sedimentary structures (Cloud et al., 1974; Peryt
et al., 1990; Aitken, 1991; Fairchild, 1993; Grotzinger and Knoll, 1995;
Kennedy, 1996; Hoffman et al., 1998a; James et al., 2001), and they are
consistently depleted in
13C relative to other Neoproterozoic carbonates
(Knoll and Walter, 1992; Kaufman and Knoll, 1995; Kaufman et al., 1997;
Hoffman et al., 1998b; Kennedy et al., 1998; Myrow and Kaufman, 1999; Brasier
and Shields, 2000; Walter et al., 2000). They share certain features with
Archean and some pre-Neoproterozoic carbonates (Grotzinger and Knoll, 1995;
Grotzinger and James, 2000; Sumner, in press), but they are without parallel
in the Phanerozoic. They have long been considered paradoxical because
they suggest that an abrupt transformation from glacial to tropical conditions
took place virtually everywhere (Spencer, 1971; Schermerhorn, 1974; Williams,
1979; Fairchild, 1993). Kirschvink (1992) did not foresee cap carbonates
as consequential to snowball events—he was unaware of their existence
(personal communication, 1999)—but they are a striking affirmation
of the second testable implication (see above) of his theory. In cap carbonates,
we see the "smoke", if not the "gun", of the snowball
Earth.
"Cap dolostones" (
Fig. 3) are the transgressive systems tracts (van
Wagoner et al., 1988) of depositional sequences ("cap-carbonate sequences")
associated with post-glacial sea-level rise. They typically grade across a marine
flooding surface (Fig. 3) into deeper water limestone or shale, which gradually
shoals upward through carbonate or siliciclastic lutites and arenites to an exposure
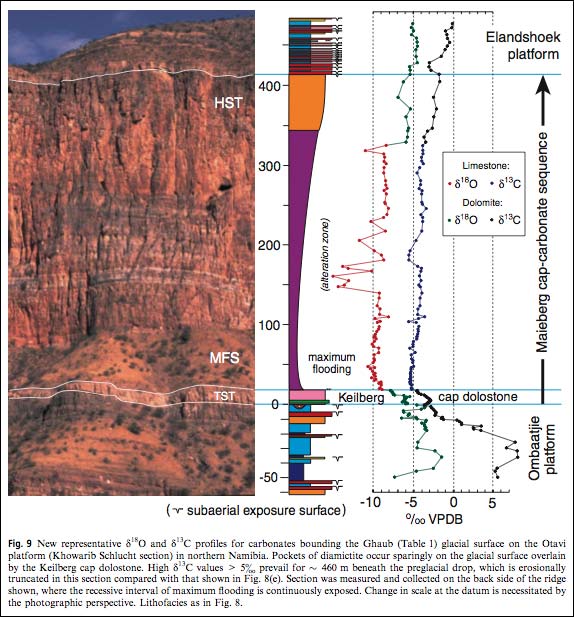
surface 100s of meters above the base of the sequence (Fig. 4a,9). The great
thickness and deep-water aspect of many cap-carbonate sequences (von der Borch
et al., 1988; Narbonne and Aitken, 1995; Dalrymple and Narbonne, 1996; Hoffman
et al., 1998b) is anomalous within their overall stratigraphic context (Fig.
9). This is commonly ascribed to post-glacial sea-level rise, but longterm tectonic
subsidence is required to preserve the sequence from isostatically-driven erosion,
because the glacio-eustatic cycle alone creates no permanent accommodation space.
On the Otavi carbonate platform in northern Namibia, an estimated background
tectonic subsidence rate equivalent to ~0.065 mm yr-1 of isostatically adjusted
carbonate (Halverson et al., 2002) implies a timescale on the order of 5 million
years to create the accommodation space occupied by the younger cap carbonate
sequence (Fig. 9), which is 300-400 m thick. Hoffman et al. (1998a) suggested
that that the snowball event occupied the vast majority of this time, when the
average sedimentation rate on the platform was very low. By the end of the event,
substantial net subsidence had occurred, although masked at that time by relative
sea-level fall. Upon deglaciation, sea level rose and chemical and/or detrital
sediments rapidly filled in the accommodation space provided, making up for "lost
time", so to speak. High sedimentation rates in cap dolostones and overlying
limestones are consistent with their low δ
13C values (see above) and with their
petrological characteristics (see below).
Petrologists being fascinated by the unusual have had a field day with cap carbonates
(Peryt et al., 1990; Aitken, 1991; Fairchild, 1993; Grotzinger and Knoll, 1995;
Kennedy, 1996; Hoffman et al., 1998b; James et al., 2001; Kennedy et al., 2001a;
Sumner, in press; Corsetti and Kaufman, submitted). The Elatina, Ghaub, Ice Brook,
Landrigan and Numees glacial deposits (
Table 1) are directly overlain by pale,
flinty, very pure, cap dolostones (Fig. 3), generally 3-30 m thick (Aitken, 1991;
Kennedy, 1996; James et al., 2001). They are invariably well laminated and, at
proper paleodepths, hummocky cross-laminated with laminae defined by sets of
reverse-graded peloids (Fig. 4b)(Aitken, 1991; Kennedy, 1996; James et al., 2001).
Structures referred to as "tepees" (Fig. 4c) occur in all the above
but they have neither the geometry nor associations of conventional supratidal
tepees (Kendall and Warren, 1987). In plan, they are linear and parallel, oriented
subparallel to the regional paleoslope (Williams, 1979; Eisbacher, 1981; Aitken,
1991; Kennedy, 1996; James et al., 2001), not polygonal like conventional tepees
(Fig. 5g), which result from lateral expansion due to the force of crystallization
(Kendall and Warren, 1987). Inspection of their cuspate axial zones (Fig.; 4d)
reveals that they formed by continuous aggradation in a highly oscillatory flow
regime. Microbial bioherms (Fig. 5a-c) and biostromes (stromatolites) occur within
some cap dolostones (Spencer and Spencer, 1972; Cloud et al., 1974; Wright et
al., 1978; Walter and Bauld, 1983; Bertrand-Sarfati et al., 1997; Hoffman et
al., 1998a; James et al., 2001; Corkeron and George, 2001). In Namibia and the
North American Cordillera, stromatolites in cap dolostones of the Ghaub, Numees
(and correlative Bildah), Wildrose, and Ice Brook glaciations (
Table 1) are distinguished
by internal, vertically oriented, tube-like or sheet-like pockets of infilled
micritic sediment and cement (Cloud et al., 1974; Hegenberger, 1987, 1993; Hoffman
et al., 1998a, 2002a). The tube-like variety (Fig. 5b) has been attributed to
gas escape (Cloud et al.,1974; Hegenberger, 1987; Kennedy et al., 2001a), but
close inspection of well-preserved examples (Fig. 5c) reveals a stromatolitic
(microbial) origin (Hoffman et al., 1998a, 2002a; James et al., 2001). The micritic
sediment gathered in shallow pits or gutters on the stromatolitic surface, which
aggraded with remarkably little change in morphology (Fig. 5b). As a result,
the sediment-filled pits and gutters became vertical tubes and sheets, respectively.
The pitted stromatolite surfaces must have resembled giant golf balls (so designed
to reduce drag). Cap dolostones have much more to reveal (Hoffman et al., 2002b),
but the whole ensemble of structures suggests rapid aggradation on storm-dominated
ramps.
Locally, cap dolostones are overlain by limestone buildups composed largely of
sea-floor cements (Peryt et al., 1990; Aitken, 1991; Grotzinger and Knoll, 1995;
Kennedy, 1996; Soffer, 1998; James et al., 2001). The cements consist of upward-fanning,
prismatic crystals pseudomorphosed by calcite (
Fig. 4f,
5e). The square-tipped,
pseudo-hexagonal habit of the crystals indicates that the primary phase was aragonite.
Although individual crystal fans are small (<1 cm), they aggregate into reef-like
masses (pseudo-stromatolites) that range from meters to decameters in scale (Fig.
5a,d). The cements did not precipitate slowly in the absence of particulate sediment,
but grew rapidly in a race against micritic burial (Fig. 4f,5d,e). The cementstone
buildups are up to 50 m thick, but eventually they give way to flaggy, allodapic,
pink limestone with large-scale hummocky cross-bedding (Maieberg Formation, Namibia),
or to black, organic-rich shale (Sheepbed Formation, Canada). The cements imply
a high degree of carbonate oversaturation (Grotzinger and Knoll, 1995; Sumner,
in press) and the dendritic-prismatic growth habit suggests rapid, diffusion-limited,
growth rates (Lasaga, 1998). The presence of dissolved Fe(II) may have inhibited
carbonate nucleation in anoxic waters below the mixed layer, thereby promoting
the growth of crystal fans on the sea floor (Sumner and Grotzinger, 1996) while
the micritic component nucleated in oxic surface waters. Deepwater anoxia is
inevitable if the ocean was ice-covered for long periods (see below) and is consistent
with dolomitization of cap dolostones on the sea floor (Baker and Kastner, 1981)
and with the co-occurrence of sea-floor barite precipitates (Fig. 4e). The localization
of these cementstone buildups at ancient shelf breaks (Soffer, 1998; James et
al., 2001) suggests that their occurrence may be dictated by upwellings.
Differences among cap-carbonate sequences have elicited debate as to temporal
versus spatial control (Kennedy et al., 1988; Brasier and Shields, 2000). Some
examples (Fig. 3d,e) lack transgressive systems tracts and their isotopic profiles
also appear base truncated—the descending phase of the δ
13C anomaly is
missing (Hoffman et al., 2001). This could result from undersaturation of the
local water mass until after the post-glacial sea-level rise was complete, bearing
in mind the large alkalinity input required to maintain saturation if atmospheric
pCO
2 rose to high levels (Fig. 10) during the hypothesized snowball event. Base
truncation appears more typical of "Sturtian" (Table 1) cap-carbonate
sequences (Kennedy et al., 1998), and could mean that the glacial ocean was less
well buffered by carbonate dissolution and/or that less carbonate was available
for weathering during deglaciation (see below). While actively subsiding areas
(Kimberley, Adelaide, Cordillera, Otavi) have thick (200-1200 m) post-glacial
sequences (Plumb, 1981; von der Borch et al., 1988; Christie-Blick et al., 1995;
Narbonne and Aitken, 1995; Hoffman et al., 1998a), the Jbéliat cap-carbonate
sequence in the cratonic Taoudeni basin (Deynoux and Trompette, 1976) is highly
condensed (Fig. 3,11). After isostatic adjustments, minimal accommodation space
remained after post-glacial sea-level rise because the background tectonic subsidence
rate was very low. The cap carbonate built rapidly to sea level, resulting in
the formation of spectacular supratidal tepee structures (Fig. 5g) and associated,
early diagenetic (phreatic), barite crusts (Fig. 5f). We speculate the latter
may have formed in a meteoric-marine groundwater mixing zone beneath a surface
exposed to the hypothesized transient greenhouse atmosphere. Where the sequence
expands to fill paleovalleys (Fig. 11), the transgressive nature of the basal
cap dolostone which drapes the paleotopography is apparent. The Jbéliat
example is also interesting inasmuch as the glacial deposits (continental tillites
and outwash) preceded the hypothesized snowball event, which is apparently represented
by a regolith horizon (Fig. 11) with well-developed polygonal sand wedges (Deynoux,
1982, 1985). This horizon separates the glacial deposits from the cap dolostone,
and marks a period when ablation exceeded precipitation in the region. Cap carbonates
also thin basinward: the Maieberg Formation is 300-400 m thick on the Otavi platform
(Fig. 9), but its equivalent (correlated isotopically) thins to <25 m within
30 km downslope from the shelf break (Hoffman et al., 1998b; Kennedy et al.,
1998).
We are not burdened by an overabundance of explanations for cap carbonates. Fairchild
(1993) suggested that they were precipitated from glacial meltwaters saturated
with alkalinity due to interaction with carbonate-rich glacial debris and rock
powder. This does not adequately explain the presence of cap carbonates in areas
where the glacial deposits have little carbonate, for example the Kimberleys
in Australia (Plumb, 1981). Grotzinger and Knoll (1995) proposed that cap carbonates
record the turnover of a previously stratified ocean (see above), with upwelling
of alkalinity-laden deepwater driving precipitation of 13C-depleted carbonates.
This model dovetails with Kirschvink's (1992) post-glacial interpretation
of Neoproterozoic BIF (Klein and Beukes, 1993), but the premise is questionable
for reasons already given. Kennedy (1996) related cap carbonates to post-glacial
flooding of continental shelves and seas, analogous to the "coral reef" hypothesis
for the Quaternary (Berger, 1982), and Kennedy et al. (2001a) hypothesized that
cap carbonates are byproducts of methane released from permafrost on continental
shelves globally during post-glacial flooding. But methane oxidized aerobically
in the water column produces CO
2, causing carbonate dissolution; only methane
oxidized anaerobically in conjunction with bacterial sulfate reduction in pore
waters yields bicarbonate (Boetius et al., 2000). If very large amounts of methane
were released rapidly (Kennedy et al., 2001a), sulfate limitaton would likely
prevent substantially increased rates of anaerobic methane oxidation. Moreover,
the characteristic spatial variability in δ
13Ccarb (-40-0‰) observed in
Phanerozoic methane-seep carbonates (Kauffmann et al., 1996) is not found in
cap carbonates. Tube-like structures purportedly conduits for methane release
(Kennedy et al., 2001a) are strictly internal to cap carbonates (
Fig. 5b): they
do not tap the conjectured methane source rocks (Hoffman et al., 2002a). They
occur only within microbial boundstones (Fig. 5c), even in cap dolostones deposited
directly on metamorphic or granitic rocks (Cloud et al., 1974; Wright et al.,
1978), unlikely to be prolific sources of methane.
Once we realized that the snowball hypothesis could explain the δ
13C anomalies
associated with LNGD, we took as a test that it should also account for cap carbonates.
Recall the deglaciation of a snowball earth, sea ice and glaciers disappearing
rapidly due to reverse ice-albedo feedback in an intense greenhouse with >10%
CO
2 (Caldeira and Kasting, 1992). As surface temperatures soar, carbonic (and
initially sulfuric) acid rain beats down on a landscape dominated by frost-shattered
rock and rock powder from glacial action, not to mention millions of years' worth
of unaltered volcanic material (Hoffman et al., 1998b; Hoffman and Schrag, 2000).
Intense chemical (and physical) weathering ensues. Initially, where former carbonate
platforms are exposed, carbonate weathering dominates. Later, after sea level
has risen, silicate weathering becomes proportionally more important, and over
time, draws down the atmospheric CO
2 until a new steady state is reached (Hoffman
and Schrag, 2000). The time scale of the greenhyouse transient is unknown, but
is conservatively estimated to be in the range 104-106 years [not <104 years
as suggested by Kennedy et al. (2001b). The alkalinity flux driving cap carbonate
deposition during post-glacial sea-level rise (i.e., below "maximum flooding" in
Fig. 3, 9) came from carbonate weathering; silicate weathering is too slow, given
a deglaciation time of <104 years (Kennedy et al., 2001b).
Large inputs of alkalinity are required to maintain seawater saturation if atmospheric
pCO
2 greatly increased in a snowball event (Fig. 10). The hydrothermal dominance
of the snowball ocean will drive down seawater pH unless it is buffered by dissolution
of carbonate, supplied for example by glacial action. Buffering would enable
cap carbonates to form immediately upon deglaciation. This is consistent with
the inference (see above) that many cap carbonates formed during post-glacial
transgression (
Fig. 3) and with the absence of post-glacial karst beneath cap
carbonates. Rapid deglaciation of a snowball Earth would emplace a growing pool
of warm, oxic, low-density, weathering-dominated water above a cold, saline,
anoxic, hydrothermally-dominated deepwater. The internal stratigraphy of cap
carbonates (Fig. 3) may reflect the mixing of these contrasting water masses
(Hoffman et al., 2002), as well as the shift from carbonate to silicate-dominated
weathering.
Test 3: Iron formations
For Joe Kirschvink, iron is king of the elements. Iron formations are extensive
deposits of sedimentary Fe(III) oxide and chert, not directly associated with
volcanoes or hydrothermal vents. Common in the early stratigraphic record (Fig.
12), they virtually disappear after 1.85 Ga (Isley and Abbott, 1999). The only
major reappearances of iron formation since that time (barring Clinton-type oolitic
ironstones) occur strictly within LNGD (Fig. 2d), notably in Canada (Young, 1976;
Yeo, 1981, 1986; Klein and Beukes, 1993), Brazil (Urban et al., 1992; Graf et
al., 1994; Trompette et al., 1998), Namibia-South Africa (Martin, 1965), and
Australia (Preiss, 1985; Lottermoser and Ashley, 2000).
The prerequisites for iron formation are three (Drever, 1974; Holland, 1984):
-
ocean anoxia to allow extensive transport of dissolved Fe(II);
- an H2S:Fe(II)
flux ratio <2, so that not all Fe(II) is scavenged by sulfide (FeS2) burial,
and
- a local oxidant to drive the precipitation of an iron-formation precursor.
Before the first atmospheric oxidation event around 2.4 Ga (Karhu and Holland,
1996), deepwaters were anoxic and riverine sulfate input was low (Walker and
Brimblecombe, 1985; Canfield et al., 2000; Farquhar et al., 2000). After 2.4
Ga, deepwater anoxia arguably persisted, but not until 1.8 Ga did oxidative weathering
drive sulfate reduction in the ocean to levels sufficient to bury all Fe(II)
as FeS
2 (Canfield, 1998). The reappearance of iron formation in LNGD, after a
1.5-billion-year absence, is consistent with ocean anoxia due to stagnation beneath
near-global sea-ice cover (Kirschvink, 1992), and also with an attenuated flux
of reduced sulfur due to the frozen surface (Canfield and Raiswell, 1999).
Kirschvink (1992) and his early supporters (Klein and Beukes, 1993) suggested
that Neoproterozoic iron formations were deposited at the end of snowball events,
when renewed thermohaline circulation would have driven Fe(II)-rich deepwater
into the oxic zone in upwelling areas. This model has been criticized on the
grounds that iron formation occurs stratigraphically within or below, rather
than above, certain LNGD (Williams and Schmidt, 2000). However, glacial erosion
at low latitudes will itself be strongly biased toward the end of a snowball
event, when the hydrologic cycle has strengthened (Fig. 7). Alternatively, iron
formation may have been deposited beneath the tropical ice pack if sea ice was
thin (<20 m) or discontinuous (McKay, 2000; but see Warren et al., 2002).
Oxygenic photosynthesis would drive precipitation, given an anoxic ocean rich
in dissolved iron. The giant Rapitan iron formations in the northern Canadian
Cordillera, for example, were deposited close to the equator (Park, 1997) and
are overlain by <600 m of glacial diamictite and outwash (Yeo, 1981). [Young
(1988) attributes the Rapitan iron formation to regional (but cryptic), rift-related,
hydrothermal activity, but this is not supported by trace-element geochemistry
(Klein and Beukes, 1993; Graf et al., 1994) and ignores the complete absence
of volcanics in the Rapitan belt and the age distribution of iron formations
globally (Fig. 12).]
Kennedy et al. (1998) pointed out that iron formation is more common in (but
not limited to) "Sturtian" glacial deposits (
Table 1). A speculative
explanation for this observation is the hydrostatic pressure dependence of the
H
2S:Fe(II) ratio in hydrothermal vent fluids at mid-ocean ridges (Kump and Seyfried,
2001). A large fall of sea level would result in a lowering of this ratio, favoring
BIF deposition (Kump and Seyfried, 2001). Many of the "Sturtian" deposits
occur in rift zones and they tend to be thicker, if more localized, than the "Varanger/Marinoan" deposits
(Eisbacher, 1981; Miller, 1985; Preiss, 1985; Young and Gostin, 1991; Brookfield,
1994; Narbonne and Aitken, 1995; Aleinikoff et al., 1995; Hoffman and Schrag,
1999). Arguably, there was more topography at low latitudes globally, giving
rise to more massive ice sheets. This would have caused a larger sea-level fall
and, according to Kump and Seyfried (2001), a greater propensity for iron formation.