 | Here
are teaching slides for "Carbon isotopes and stratigraphic correlation".
You can see a full-size version by clicking on the thumbnail. You can then
download that slide individually by right mouse clicking on it; using the "Save
As" command in the File menu; or in most cases, by simply dragging it to your
desktop.
|
|
 | 5.2:
Steady-state variation in carbon isotopic composition of calcium carbonate
(δ13C)
and organic matter (δ13Corg) as a function
of their relative proportion in the sediment burial flux, assuming carbon
input into the ocean-atmosphere
is constant at -6‰ VPDB. δ13C from the present ocean
is ~0‰,
implying a burial flux ƒorg = ~0.2, assuming steady state.
Observed pre-Marinoan
δ13Ccarb values ~5‰ for long periods
(107-108 years) implies ƒorg
= ~0.4.
|
|
 | 5.3:
Published
δ13Ccarb values over geological time (Shields & Veizer,
2002). Note persistent mean values 0-3‰, and anomalous variability
2.3-2.0 and 0.8-0.6 Ga, broadly correlative with snowball earth episodes.
|
|
 | 5.4:
Composite δ13Ccarb record from 820 to 490 Ma, based on carbonate-dominated
successions
in Australia, Canada, Namibia, Morocco and the western U.S. (modified after
Halverson et al., 2005). Cambrian “explosion” in faunal (and
floral) diversity from Knoll & Carroll (1999).
|
|
 | 5.5:
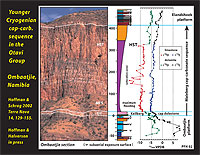
Stratigraphic architecture, generalized sedimentary facies, U-Pb ages of volcanic zircons and composite carbon isotope profile for the Otavi Group, projected onto a north-south cross-section of the carbonate platform and its southern foreslope. Note rift-drift transition at the base of the Ombaatjie Formation. The 635-Ma Ghaub glaciation occurred after the rift-drift transition and the older Chuos glaciation before it.
|
|
 | 5.6:
Comparison of δ13Ccarb profiles for the Abenab Subgroup, deposited between
the older
and younger Cryogenian glaciations, on the outer, middle and inner parts
of the Otavi Group platform. Note consistent and progressive increase in
values from outer to inner areas, and inflation of the isotopic gradient
at the time of the rift-to-drift transition (base of Ombaatjie Formation).
|
|
 | 5.7:
Columnar sections of the Ombaatjie Formation from south to north across
the Otavi carbonate platform in Namibia (after Halverson et al., 2002).
Datum (red line) is the 0 (VPDB) crossing in the Trezona δ13C
anomaly. Note the local relief (<60 m) on the sub-Ghaub glacial erosion
surface but the regional-scale paraconformity between the erosion surface
and the datum. There is no evidence of structural rotation coincident with
the Ghaub glaciation.
|
|
 | 5.8:
Large (>10‰) downward gradients in δ13Ccarb are
observed beneath the Stelfox (Canada), lower Polarisbreen (Svalbard), Ghaub
(Namibia), Elatina
(Australia) and Port Askaig (Scotland, not shown) glacials. They occur
beneath the younger glacial in Australia (type Trezona isotope anomaly),
Canada and Namibia, but beneath the older glacial in Svalbard and possibly
Scotland. Is there one Trezona anomaly that can thereby be used for global
correlation, or did Trezona-like anomalies (variably preserved) precede
both Cryogenian glaciations? As the anomalies occur in relatively shallow-water
platformal sections, they must lead any large sea-level fall associated
with ice-sheet buildup.
|
|
 | 5.9:
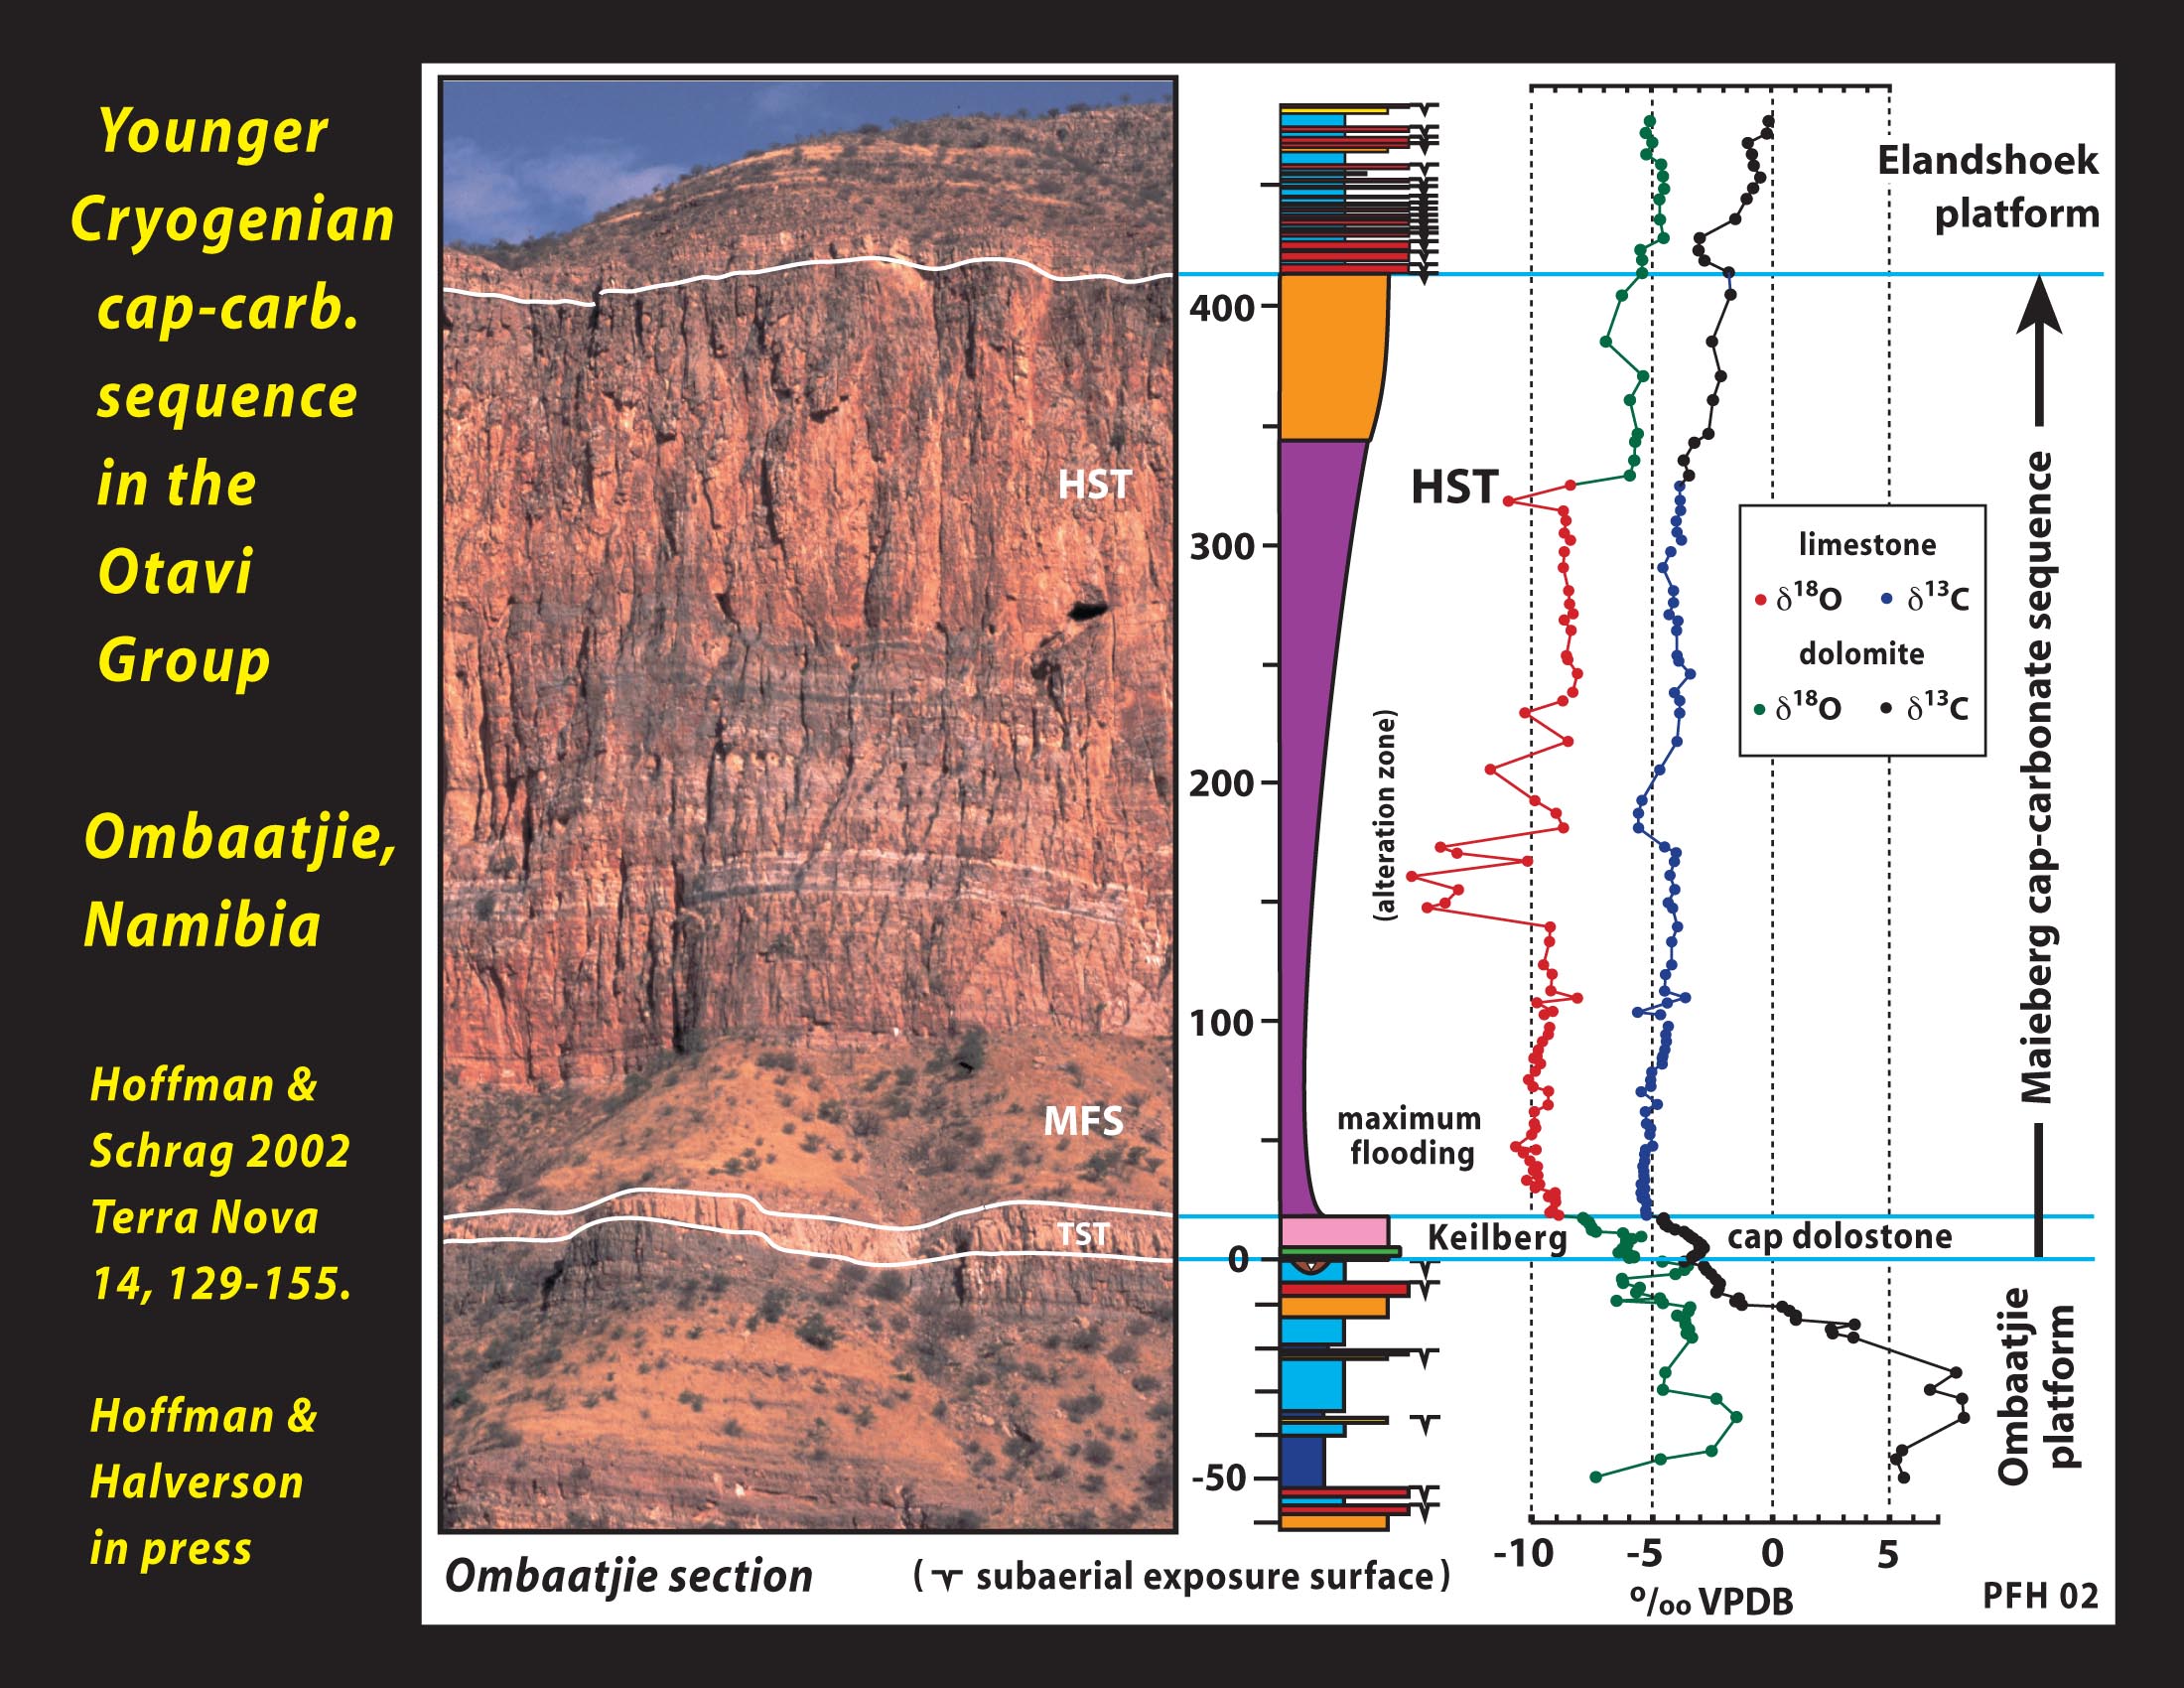
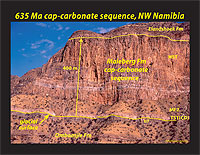
Younger Cryogenian (Marinoan) cap-carbonate sequence (Maieberg Formation)
near
Ombaatjie on the Otavi Group carbonate platform, NW Namibia. Top of the
depositional sequence is the first subaerial exposure surface above the
glacial horizon. At 400 m, this sequence is 16x and 80x thicker than those
in the underlying and overlying formations, respectively.
|
|
 | 5.10:
Lithologic column with corresponding carbon and oxygen isotopic records
for the upper
Ombaatjie through lower Elandshoek Formations, near Ombaatjie, Otavi Group
platform, Namibia.
|
|
 | 5.11:
Regional variation in thickness, lithology and carbon isotopic record of
the Keilberg
cap dolostone and overlying limestone across the Otavi Group platform (above)
and southern foreslope (below), Namibia.
|
|
 | 5.12:
Carbon isotopic record of the Keilberg cap dolostone on the Otavi Group
platform,
middle foreslope and deep foreslope. Is the apparent offset in values related
to water depth or secular change (and diachronous deposition)?
|
|
 | 5.13:
Carbon and oxygen isotopic records (scaled for thickness) of the younger
Cryogenian
post-glacial cap dolostones in Australia, Canada, Namibia and Svalbard.
Similarity of carbon isotopic profiles within and between regions suggests
that they record seawater values and were not grossly altered during diagenesis,
as proposed by different research groups.
|
|
 | 5.14:
Carbon and oxygen isotopic records for the younger Cryogenian (Marinoan)
cap-carbonate
sequence (Tsabisis Formation) in the Naukluft allochthon, NW Kalahari craton,
Namibia. .
|
|
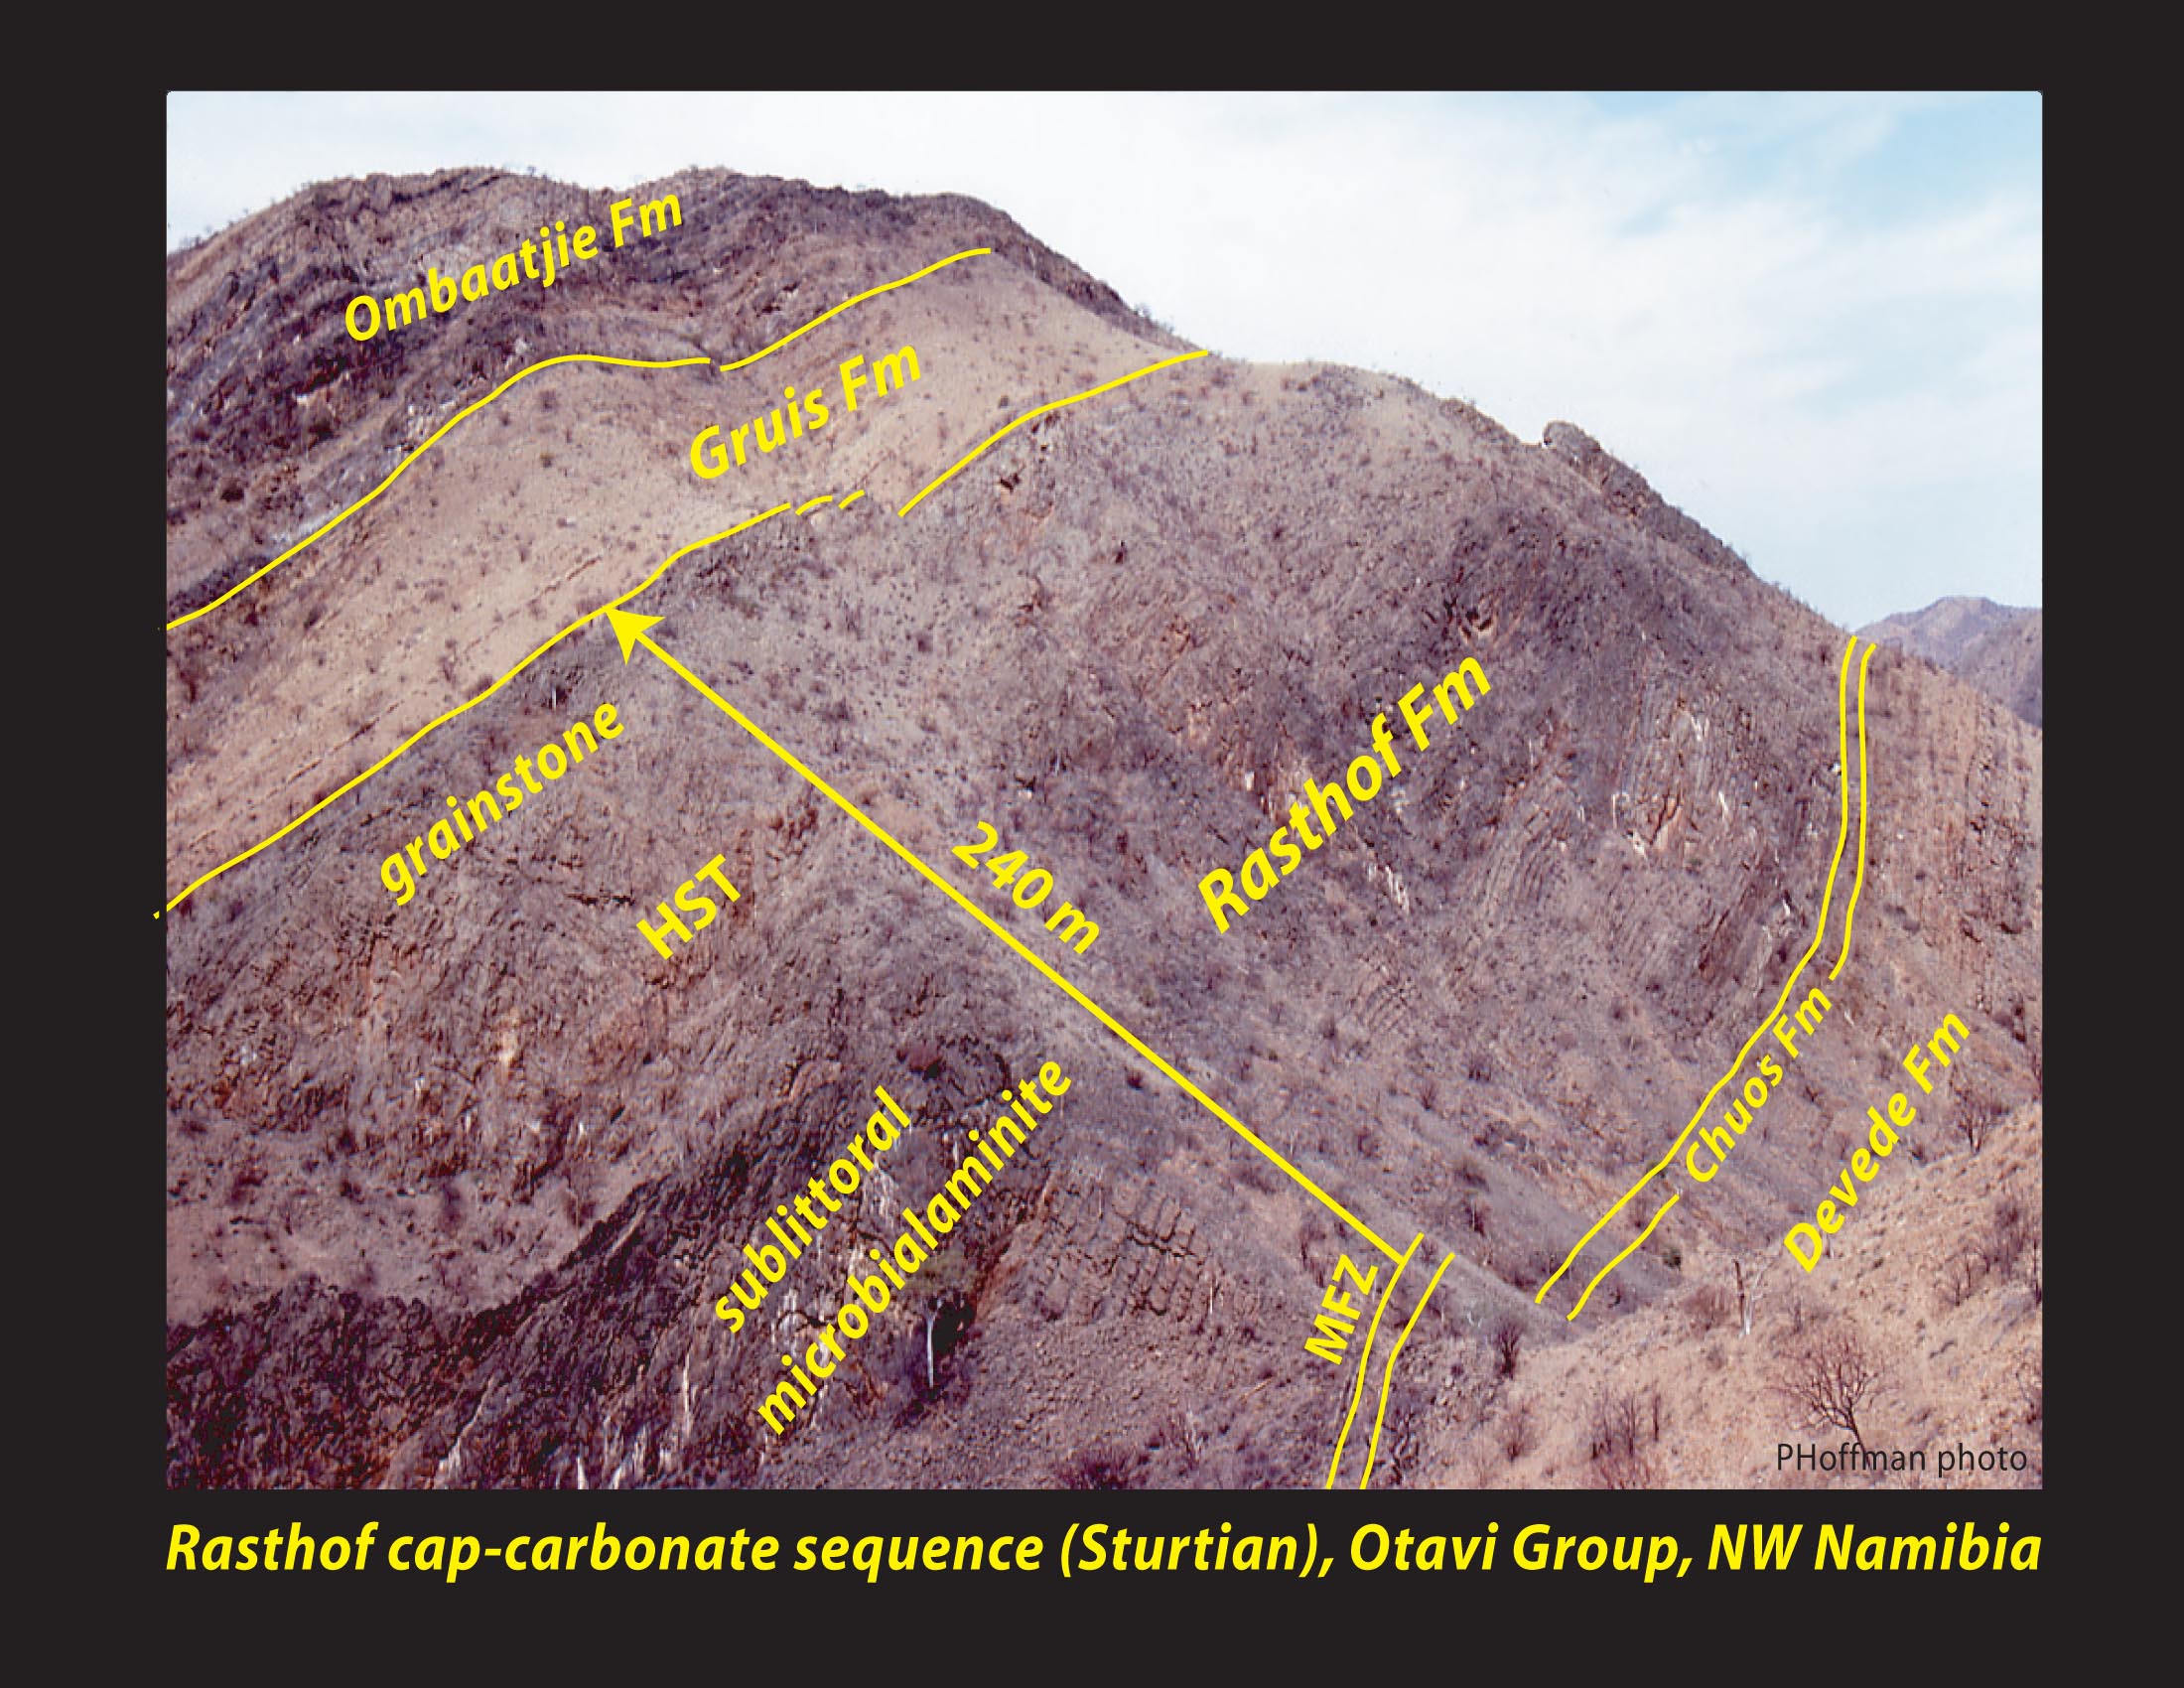
 | 5.15:
Older Cryogenian (Sturtian) post-glacial cap-carbonate sequence (Rasthof
Formation
near Omukutu, upper Hoanib River, Otavi Group platform, Namibia. The thin
glacials (Chuos Formation) at this location consist of proglacial quiet-water
deposits with ice-rafted debris.
|
|
 | 5.16:
Regional variation in lithology and carbon isotopes of the older Cryogenian
(Sturtian)
Rasthof cap-carbonate sequence in the Otavi Group, NW Namibia. Platform-foreslope
differentiation was not well-established in Rasthof time.
|
|
 | 5.17:
Geochemical model of the carbon isotopic record (δ13Ccarb)
of seawater in the aftermath of a snowball earth by Higgins & Schrag
(2003). Cap dolostone deposition is driven by alkalinity input from carbonate
weathering
and by temperature rise. Limestone deposition is driven by carbonate and
silicate weathering, with comensurate lowering of atmospheric pCO2.
|